From 2022 – 2024, the Estuary Partnership worked with USGS and the Columbia River Inter-Tribal Fish Commission to follow up on previous studies in the Tracking Toxics in the lower Columbia Project. We sampled the same 10 sites previously used for the 2007 Toxics Study and the 2008–2010 ConHab Study, and analyzed compounds included in those studies as well as contanimants of emerging concern:
- PAHs
- PBDEs
- PCBs
- pesticides
- wastewater indicators (including pharmaceuticals and personal care products)
- Per- and polyfluoroalkyl substances (PFAS)*
- cyanotoxins*
- tire particles (6PPD)*
*Contaminants of emerging concern new to these data.
These data allow us to assess certain changes over time based on past studies. Samples for this study were taken in 2023, leaving a 14-year gap in data. Our region lacks funding for ongoing toxics monitoring in the main stem Columbia River.
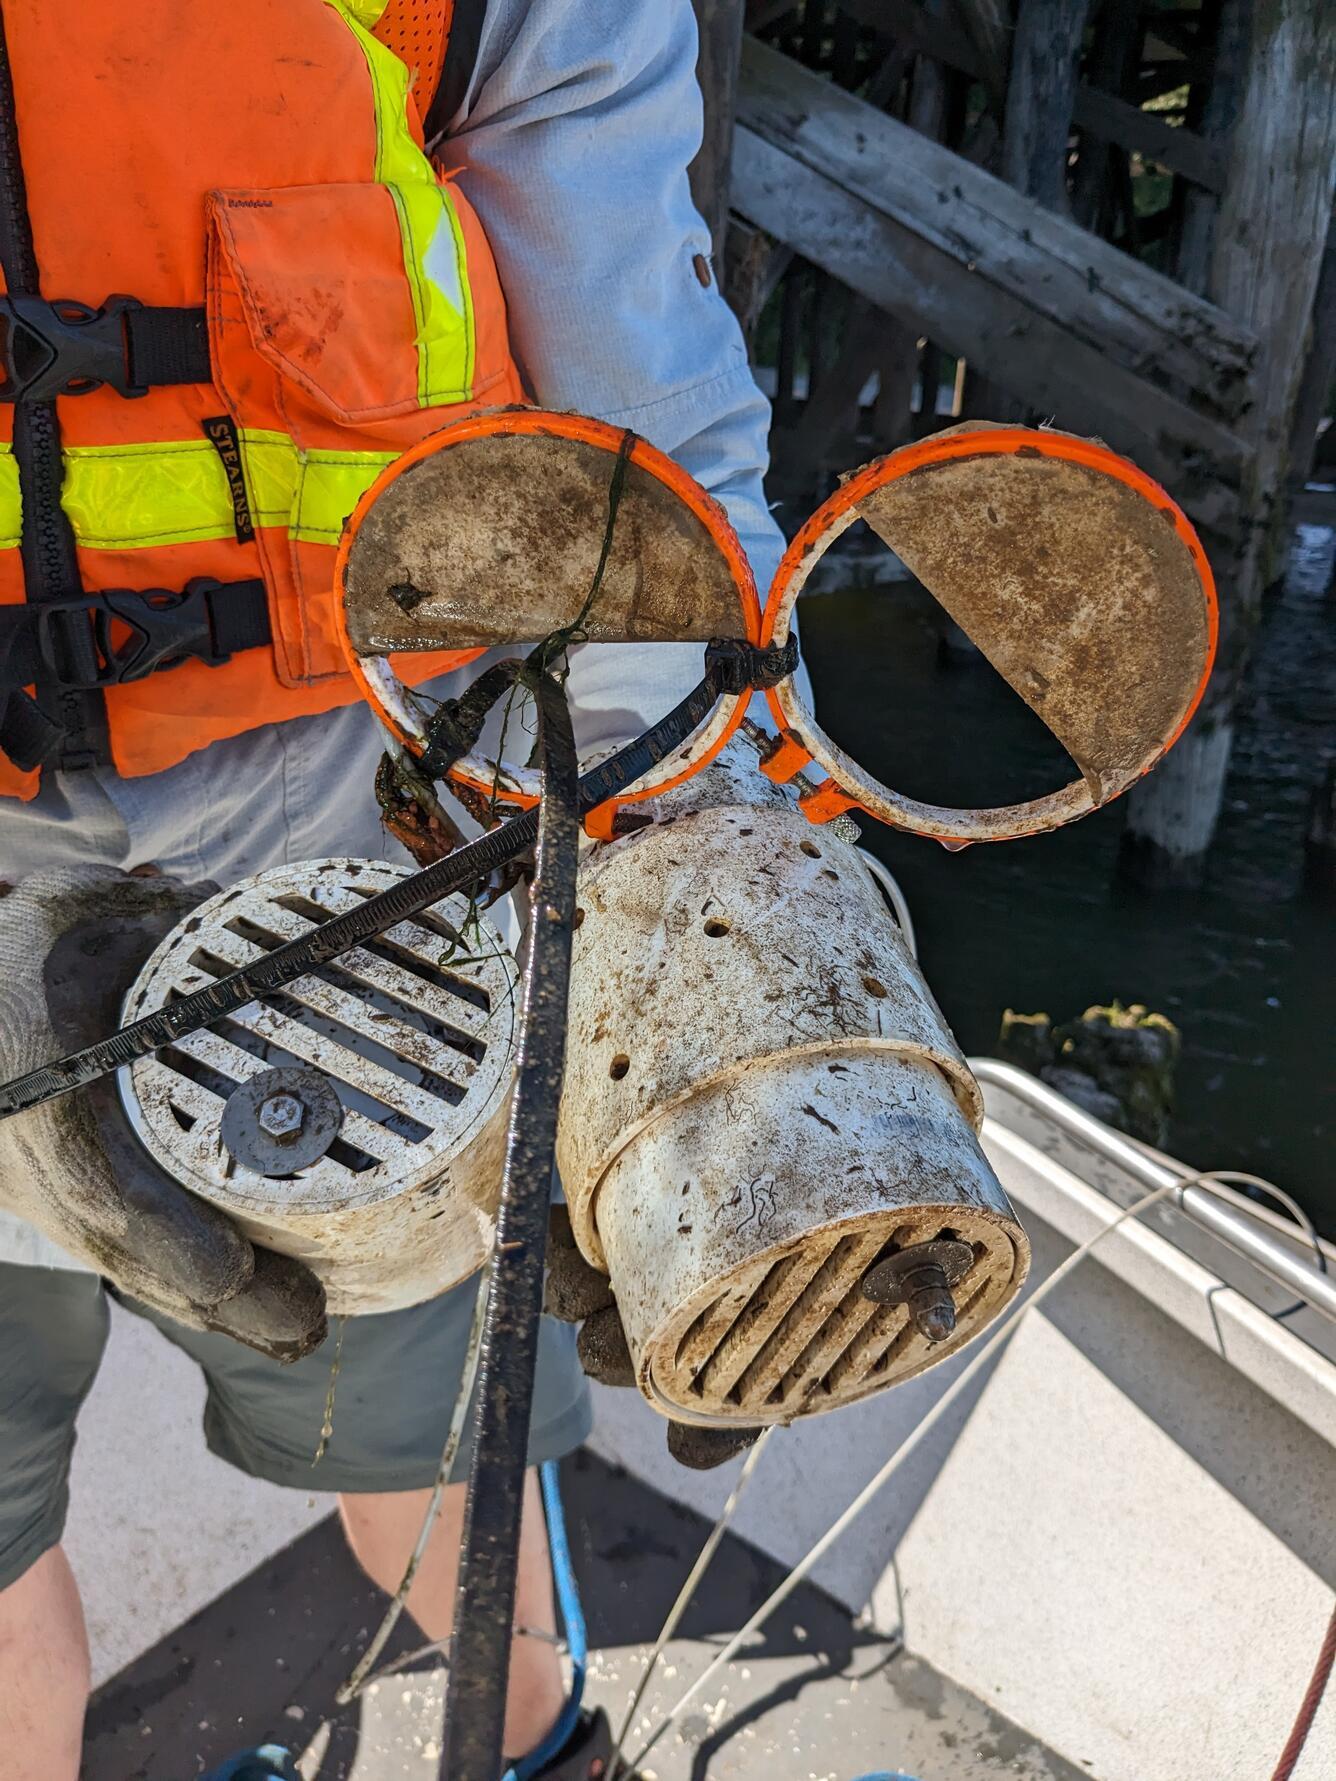
Sampling took place three times:
- At the beginning of the rainy season (late October/early November) to capture conditions representing the first flush of stormwater runoff
- During peak snowmelt, also known as the spring freshet (April/May), to capture high-flow contributions from the upriver watershed
- During peak summer (August/early September) to capture warm, low to moderate flow conditions
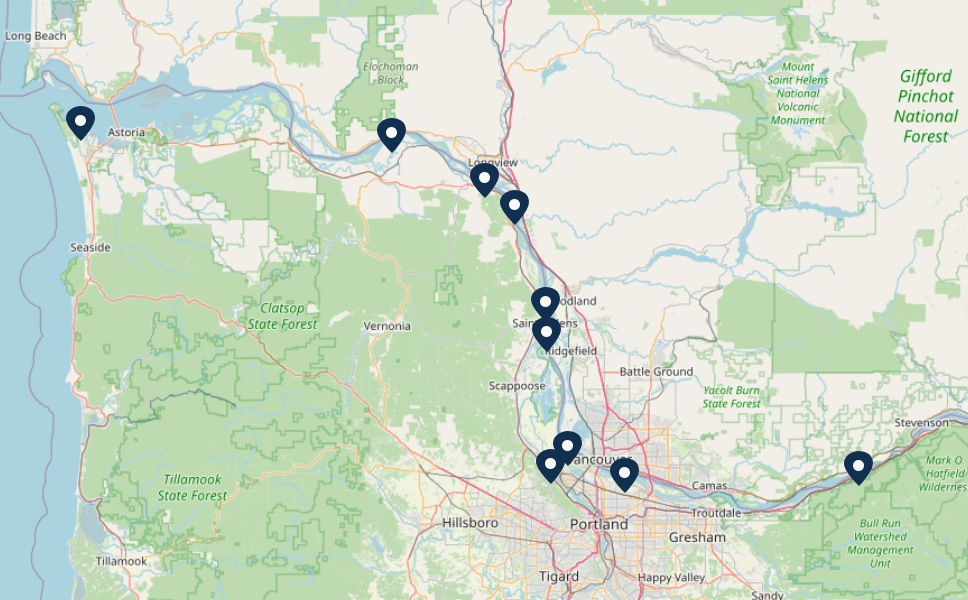
Sampling locations across the breadth of the lower Columbia River (listed from upriver to downriver):
- Columbia River at Skamania Boat Dock
- Columbia River downstream of Government Island
- Columbia River downstream of Hayden Island
- Willamette River at Multnomah Channel
- Multnomah Channel near mouth
- Columbia River at Columbia City
- Columbia River between Lewis and Cowlitz Rivers
- Columbia River at Longview
- Columbia River at Beaver Army Terminal RM 53
- Columbia River near Point Adams
Map credit: USGS
Overall takeaways from the data:
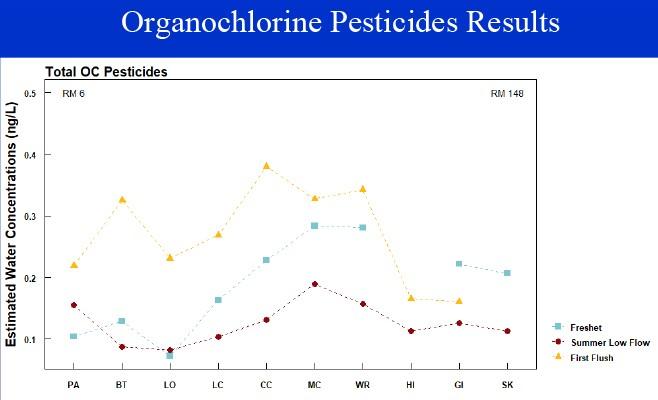
- The highest concentrations of organochlorine pesticides were found around the urban area from Portland through Longview. DDE and DDD – products of DDT break down – were the most common found, showing the pervasiveness of this pesticide despite its ban in the 1970s.
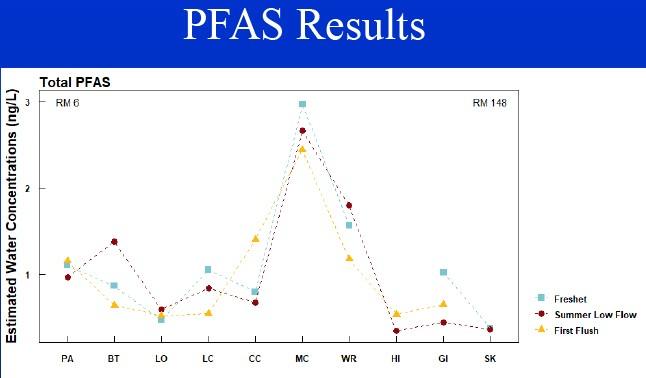
- PFAS, which come from sources including firefighting foams as well as waterproof garments, were also found most concentrated from the urban corridor around the Multnomah Channel and Willamette River.
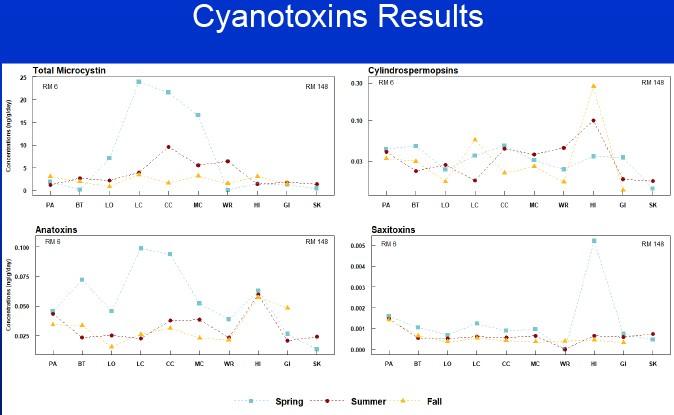
- Cyanotoxins—caused by cyanobacteria, or harmful algal blooms—were detected at every site and every season. Certain cyanotoxins (microsystins and anatoxins) were especially concentrated from Multnomah Channel to Longview, in the most industrialized stretch of the lower river.
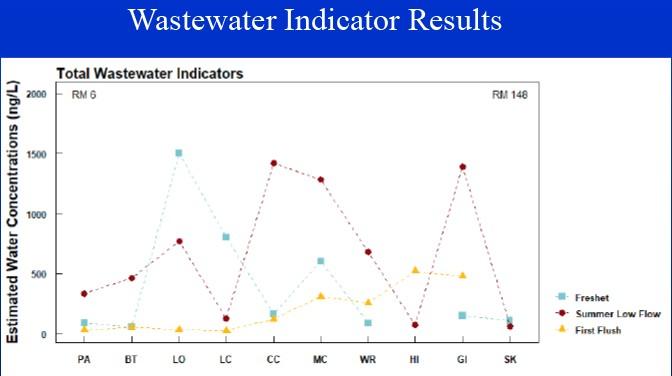
- Wastewater indicators had highest detection during the spring freshet and summer low flow conditions, though concentration upstream was highest during the spring freshet.
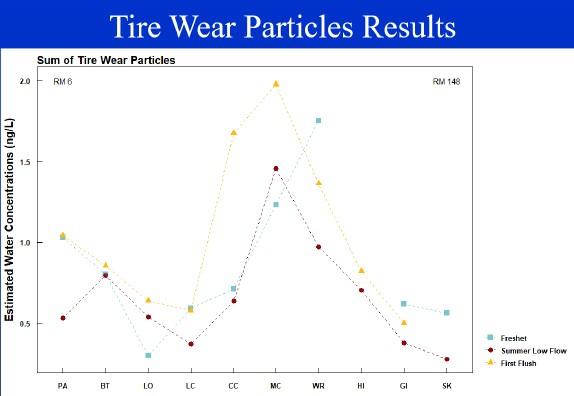
- 6PPD compounds from tire particles were found in the highest concentrations in the area from the Willamette River through Columbia City, near the densest concentration of roadways in the Portland-Vancouver metro area.
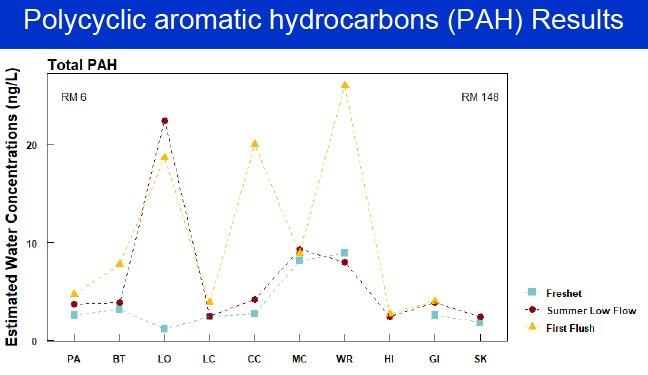
- PAHs, which are derived largely from the combustion of gasoline, were found at sporadic but high levels throughout the river, consistent with previous findings.
- In a bit of good news, no PCBs were found during sampling.And PBDEs, which are fire-retardants used in plastics, cushions, and fabrics, also had a very low detection level throughout the sampling areas.
Below are charts showing the results from each category of contaminants included. Abbreviations for all charts begin at the mouth and proceed upstream:
PA – Point Adams
BT – Columbia River at Beaver Army Terminal
LO – Columbia River at Longview
LC – Columbia River between Lewis and Cowlitz Rivers
CC – Columbia River at Columbia City
MC – Multnomah Channel near mouth
WR – Willamette River at Multnomah Channel
HI – Columbia River downstream of Hayden Island
GI – Columbia River downstream of Government Island
SK – Skamania
This project was funded through a grant from the US EPA Columbia River Basin Restoration Program.