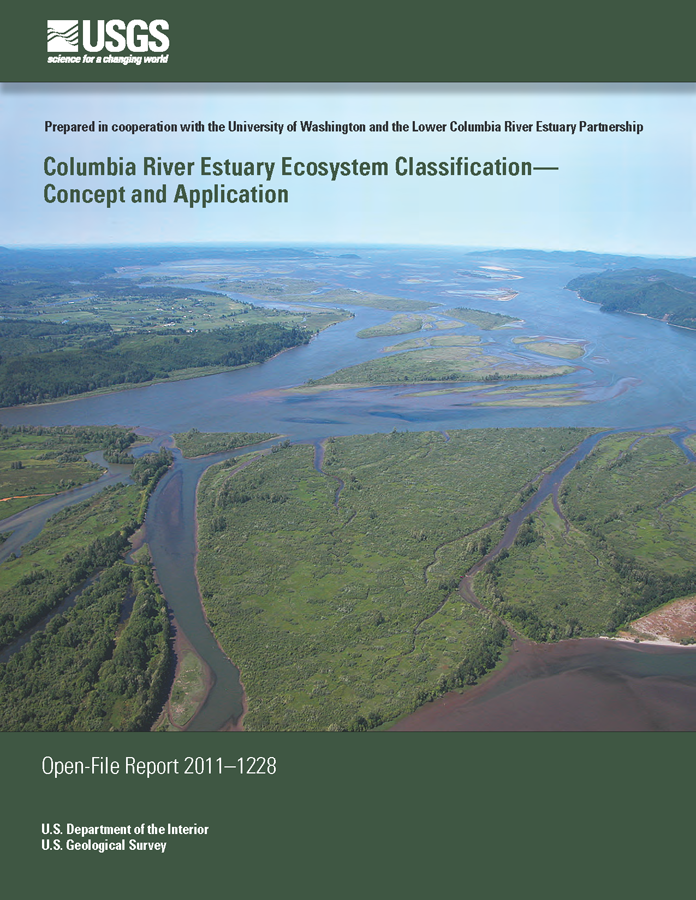
The Columbia River Estuary Ecosystem Classification (CREEC) has been a collaborative effort between the Estuary Partnership, USGS Western Fisheries Research Center, USGS Water Sciences Center, and the University of Washington School of Aquatic Resources Wetland Ecosystem Team. Completed in May 2012 after nearly seven years of development, the CREEC is comprised of a hierarchical group of 6 geospatial data sets which characterize the unique ecosystem of the lower Columbia River and estuary. The framework was developed for applications in larger river systems characterized by very long reaches of tidal freshwater (nearly 200 km, in the case of the lower Columbia). These types of systems are not well described by previously existing classification frameworks. The CREEC is intended to improve the understanding of controlling physical factors that drive ecosystem evolution along the lower Columbia River and estuary, as well as to provide an inventory of contemporary landforms. The various hierarchical levels describe the hydrologic regimes, as well as the geophysical processes which have formed the unique landscape over geologic time. Three of the six levels are directly applicable to estuarine research, restoration, monitoring, and management in the lower Columbia. In addition to characterizing natural process and functions, the CREEC also includes a detailed layer of various anthropogenic features throughout the floodplain, including levees, dredge material deposits, drainage ditches, transportation features, and other features.
Hierarchical Levels of the Classification
-
Levels 1 & 2
Levels 1 and 2 of the CREEC are taken directly from the EPA-adopted Ecoregion Levels II (Ecosystem Province) and III (Ecoregion) respectively. These provide regional context at the lowest levels of the hierarchy.
-
Level 3: Hydrogeomorphic Reaches
This level is based on EPA Ecoregion level IV, with modifications made to reflect the formative geologic and tectonic processes which created the existing estuarine landscape and encompass the influence of the resulting physiography on interactions between fluvial and tidal hydrology and geomorphology. To date, level 3 has been used extensively for management purposes, including site selection for the Estuary Partnership's as well as other partners' regional monitoring programs.
Level 3 Hydrogeomorphic Reach downloadable GIS layer and metadata
-
Level 4: Ecosystem Complexes
For the most part, the Ecosystem Complex category reflects geomorphic processes and episodic geologic events of the Holocene (last 10,000 years), resulting in landforms such as terraces, dune fields, flood plains, volcanogenic deltas, and channels. Thus, Ecosystem Complexes are influenced by the overlapping effects of massive Holocene disturbances (such as landslide and volcanic sediment pulses, large floods, storm surges, or tectonic movements), shorter-term biophysical processes (such as erosion and sedimentation associated with localized flooding, vegetation succession, local extinction and recruitment events), and anthropogenic modifications of the landscape (such as diking and filling, channel hardening, and urban and suburban development on the flood plain).
Level 4 Ecosystem Complexes downloadable GIS layer and metadata
-
Level 5: Geomorphic Catanae
Geomorphic catanae form the mosaic of shifting physical and biological features nestled within ecosystem complexes. For the Columbia River Estuary, geomorphic catanea consist chiefly of individual landforms created during the last 2,000 years since rate of sea level rise diminished markedly. Examples of such landforms include individual bars, levees, islands, and ponds. The dynamics of these processes result in more temporal variation of landscape patches categorized at this level of the Classification. Geomorphic catenae have been classified and delineated in two steps: (1) witihin ecosystem complexes, multiple mapping criteria are used to distinguish water body and floodplain features; and (2) - Level 6 Primary Cover Class data are applied to delineate discrete biological communities associated with the geologic/geomorphic units delineated in step (1).
-
Level 6: Primary Cover Class (Land Cover)
The Primary Cover Class, or land cover, structure is the finest level of the hierarchical scheme. While the primary cover class comprises it's own hierarchical level, its primary purpose was to further delineate the Level 5 geomorphic catenae into 'biocatenae'. These biocatanea, generated using statistical multivariate analysis techniques, systematically organize how and where the structure and type of biological features are comparable within the geomorphic catenae. Subcatanae delineations generated using the Primary Cover Class data are attributed in the Level 5 Geomorphic Catenae GIS data set (see above for data link).
The Primary Cover Class data set used in the Classification was developed by the Estuary Partnership, in 2010. It represents the most current and comprehensive land cover data available for the lower Columbia floodplain.
Level 6 Primary Cover Class map page and downloadable GIS data
-
Anthropogenic Features
As part of the CREEC effort, we also mapped a comprehensive set of anthropogenic features within the lower Columbia floodplain. Features were derived solely through the use of high resolution elevation (LiDAR) source data, thus only features with some topographical expression were included. Types of features mapped include levees, ditches, dredge material fill, elevated roadways and rail lines, among others.
Columbia Estuary Ecosystem Classification Map
The map application below includes layers of the primary levels of the Classification (levels III-V), as well as the anthropogenic features layer.
Use the buttons at the top right corner of the map to control display of individual layers, which are all turned on by default.
Click individual features to generate a pop up window with detailed information about each feature